Testing for Algorithmic Bias
Cierra Oliveira, July 29, 2020
It is a misconception that machine learning yields completely objective decision making. Rather, artificial intelligence only operates objectively on the material humans teach it. Troubling outcomes begin to arise when the input data used to train these models contain bias.
Predictive tools for assessing recidivism risk, calculating credit quotas, and hiring new employees have all recently come under scrutiny for discriminatory decision making. Despite efforts to eliminate human biases, algorithms built to automate decisions may replicate, and potentially amplify, those biases. For example, Amazon discovered that the hiring algorithm used on job candidates was biased against female applicants. The tool was trained on resumes from past successful job candidates and was able to track patterns in previous hiring decisions. The company discovered that certain words in the resumes were becoming associated with successful candidates. Specifically, Amazon pointed out verbs expressing confidence and task descriptions as positive predictors. The users of these phrases, as it turned out, happened to overwhelmingly male. The association of gendered-phrasing to recruitment can be tracked the company’s historical hiring pattern, with a global gender distribution of 60% men employees and 74% male managerial roles.
This process is what many scholars have described as “Garbage in, garbage out”. Because predictive models learn from patterns in training data, bias in input data can be picked up by the algorithm. In Amazon’s case, gender bias in previous hiring decisions was learned by the algorithm by prioritizing popular phasing used in male candidates’ applications.
Researchers often argue that bias in machine learning can be traced back to training data. As tools that aim to maximize prediction accuracy on training data, the algorithm may be performing “fairly” given patterns in the input data while making decisions a human would deem unfair. This, ultimately, leads us to a conversation about causes of bias and evaluations of algorithmic fairness.
Researchers (Barocas and Selbst, 2016) note a number of ways bias occurs in training datasets:
-
Skewed Samples: In hand-labeled data sets, researchers are burdened with classifying examples with their own inevitably subjective judgement. Because labels applied to training data serve as ground truth for the model, patterns in those decisions will be replicated in future cases. In the case of Amazon’s hiring algorithm, human bias in previous hiring decisions led to skewed results that favored male applicants.
-
Sample-Size Disparities: If the input data contains a disproportionate number of examples from the minority group, it is less likely to sufficiently model that group.
-
Proxies: Even when sensitive information (e.g. race or gender) is hidden from input data, other features can become proxies for those attributes (e.g. zip code). In this way, these features can be associated with certain groups and lead to unwanted outcomes. Amazon’s recruiting tool punished applications containing words like “women” in phrases such as “women’s soccer team” or “women’s college”. Another similar resume screening tool was found to have the name “Jared” and whether one played high school lacrosse as the most indicative factors of job performance.
Algorithmic fairness can be evaluated using several metrics:
-
Statistical Parity: This condition equalizes the outcomes across the majority and minority groups. In the case of Amazon’s hiring tool, acceptance rates from both groups of applicants must have been equal to achieve statistical parity.
-
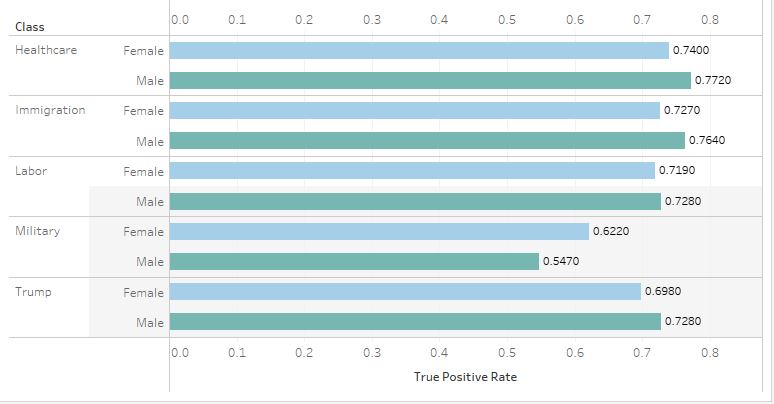
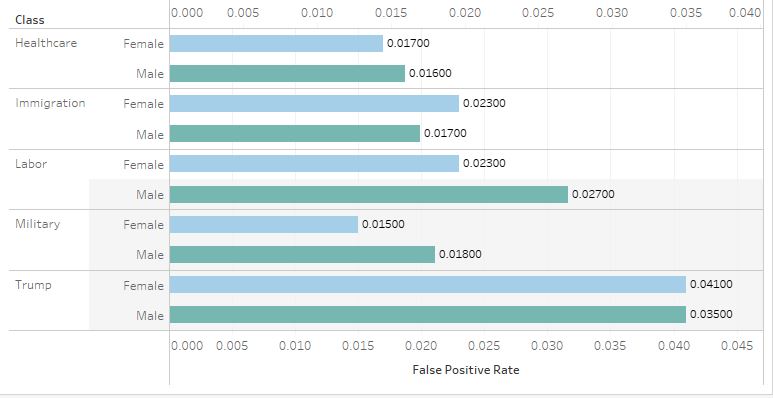
Equalized Odds: This is a condition where true positive rates and false positive rates are the same for each population. The ROC curve captures the false positive and true positive rates at different thresholds. A classification with equalized odds would have ROC curves that agree across groups.
-
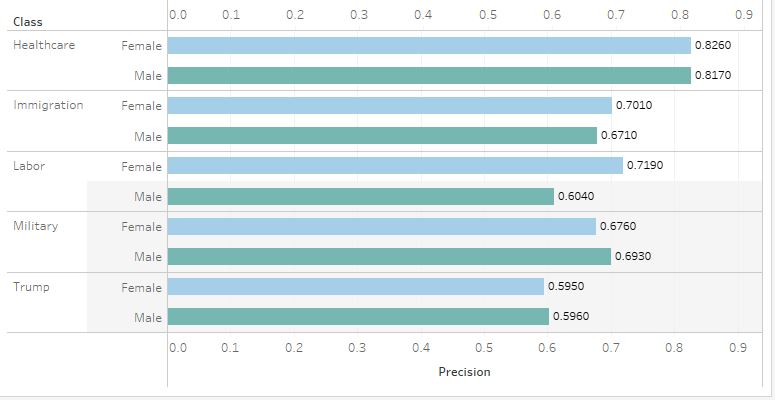
Predictive Parity: A classifier achieves predictive parity if both protected and unprotected groups have equal Precision – the probability of a subject with positive predictive value to truly belong to the positive class. Take the example of an algorithm that predicts whether loan applicants have a good or bad credit score. The tool would have predictive parity if for both male and female applicants, the probability of an applicant with a good predicted credit score to actually have a good credit score should be the same.
-
Overall Accuracy Equality: This condition requires groups to have equal prediction accuracy. This would mean the probability of an actual qualified job candidate being correctly labeled as qualified and the probability of an actual unqualified candidate being correctly labeled as unqualified is the same across male and female applicants.
With these causes and definitions in mind, I decided to test the algorithmic fairness of a tool used to predict the topics discussed in tweets by political officials. My research group has spent the past year developing a model that is capable of predicting policy issue topics in tweets by officials in the 113th- 116th U.S. House of Representatives. After reading possible causes of algorithmic bias, a red flag was raised. Because women made up ~20.9% of members in the 113th-116th terms, this disparity was also reflected in our training data. We used a hand-labeled dataset with the same number of randomly selected tweets from every representative serving in that timeframe. In other words, our dataset suffered a sample-size disparity capable of resulting in disparate classification outcomes across male and female officials.
Some research has suggested that gender plays a role in political communicative behavior. I began to hypothesize that our algorithm could be learning gendered communication patterns in our training set of tweets by an overwhelming male majority. I feared the gender disparities in our dataset could be replicated by our algorithm and lead to disparate results in classification.
Our entire training set contained 3600 tweets by political elites, 795 of which were from female politicians. I tested the groups for Equalized Odds, Predictive Parity, Overall Accuracy Equality on five different policy issues:
Equalized Odds
Predictive Parity
Overall Accuracy Equality with F1 Scores
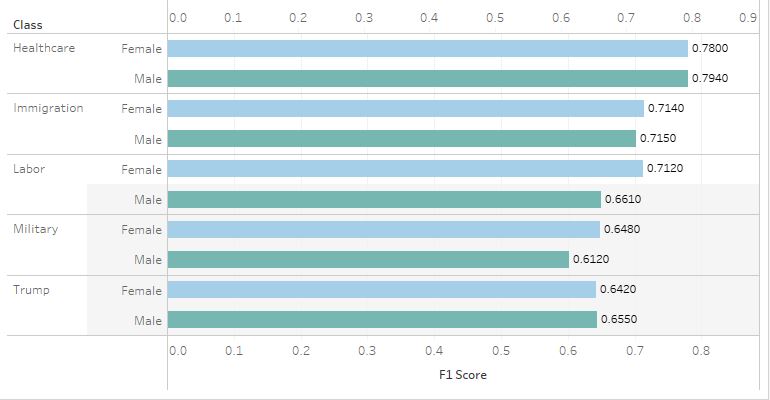
Across all three tests, tweets by both Female and Male groups performed around the same. For True Positive Rates, the Male group outperformed the Female group only slightly, except in the case of tweets discussing the military. This, however, was not the case in other tests. The Female group slightly outperformed the Male group in precision for tweets discussing healthcare, immigration, and labor. None of the tests, nor any policy issues, showed an outstanding disparity between the two groups. Overall, I would safely say the model passes the three tests of algorithmic fairness.
While my hypothesis was proven wrong and the experiment failed to show an example of biased outcomes, this can serve as an example of how to test your our suspicion of algorithmic discrimination. Scholars, tech companies, and lobby groups are calling on researchers to practice algorithmic hygiene. In practice, this can mean acknowledging potential causes of bias and employing practices to identify them.
Other Resources:
Featured Image from https://www.vox.com/recode/2020/2/18/21121286/algorithms-bias-discrimination-facial-recognition-transparency
https://www.emerald.com/insight/content/doi/10.1108/JICES-06-2018-0056/full/html
https://www.vox.com/recode/2020/2/18/21121286/algorithms-bias-discrimination-facial-recognition-transparency
https://nvlpubs.nist.gov/nistpubs/ir/2019/NIST.IR.8280.pdf
https://arxiv.org/pdf/1701.08230.pdf
https://fairware.cs.umass.edu/papers/Verma.pdf
https://hbr.org/2019/08/using-algorithms-to-understand-the-biases-in-your-organization